

PATHs to 2030: presented the intermediate data of the project promoted by the Cluster to measure transport emissions and consumption
Published 23 October 2022
Define the possible trajectories of road transport to achieve the objectives of the Fit for 55 package, which provides for the reduction of greenhouse gas emissions in the EU by at least 55% by 2030 compared to those recorded in 1990 and to make Europe climate neutral by 2050.
With this objectives, Cluster Trasporti has promoted and financed the PATHs to 2030 project, which sees the collaboration of Universities and Research Centers (University of Campania Luigi Vanvitelli, Federico II University of Naples, Universitas Mercatorum, CNR – Stems), to trace a photograph updated to 2019 of how much transport affects emissions of polluting gases and in terms of energy consumption. The novelty and peculiarity of the study lies in the fact that it is based on the intersection and comparison of available data from different sources, which in some cases are also very distant from each other.
Officially started in the spring of this year, the project reached a first important milestone: the presentation of the intermediate results, the return of data that represent the shared basis on which to base the most appropriate policies to effectively pursue the decarbonization objective. An inventory of transported by segments and number of vehicles in Italy. Investigation tool on emissions and energy consumption effects, which also tells of the difficulty of making certain predictions for the future.
The purpose of the PATHs to 2030 study is to draw up a traffic inventory, i.e. to establish how many vehicles/km are present on the road, how many emissions they produce and how much energy they need. Secondly, the study aims to trace possible decarbonization trend scenarios for 2030, to understand how close we can get to the threshold of the values set by the Fit for 55.
Data on emissions and energy consumption of road transport
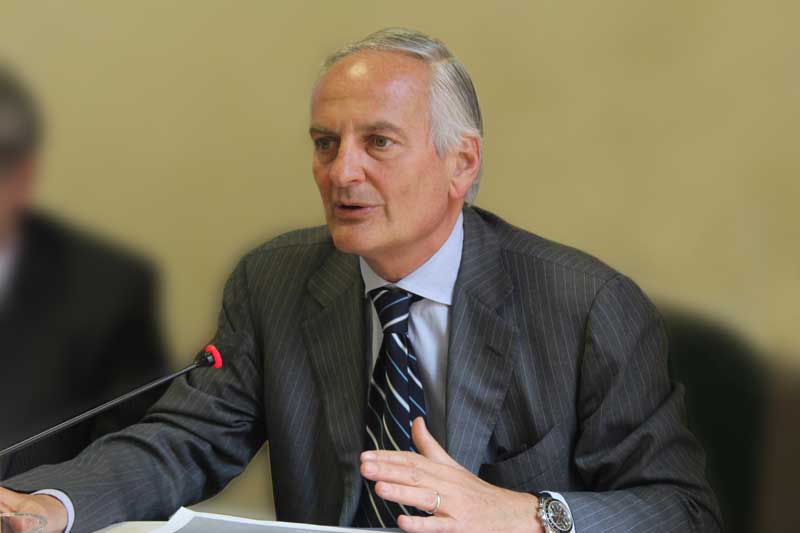
The first results of the project were presented by the President Cluster Trasporti Ennio Cascetta during a meeting convened at the Ministry of Sustainable Infrastructures and Mobility, in which he immediately pointed out that an underlying problem is constituted by the fact that in previous studies quantifying emissions in our country, the impact of road freight transport is underestimated. Emissions that account for 40% of the total. An aspect that makes it difficult to imagine paths to achieve the Fit for 55 goals.
According to official Ispra data, transport in our country accounts for 25% of total emissions, in 2019 they increased by 5% compared to 1990 and 92% of emissions are produced by road transport.
Most of the studies available for both the freight and passenger sectors are based on ASI policies – i.e. on the Avoid, Shift, Improve logic – or simply Improve, i.e. the improvement of the fleet, with particular emphasis on electric vehicles. In these studies, however, for the most part it is not clear the path through which to reach the 2030 goals and in many cases it is concluded that these are unattainable scenarios.
The novelty of the PATHs to 2030 approach consists in the fact that the reference framework is reconstructed on the basis of data coming from many different sources – Mims, Ispra, Isfort, Istat, Aiscat, Anas, Aspi, Aci – which are elaborated in a top / down and bottom / up cross validation mechanism.
The survey covers the entire network of highways, urban and extra-urban roads, cars, passenger transport vehicles – from cars to buses – commercial, light and heavy vehicles, taking into consideration a total of 60 segments.
In particular, for freight transport, the data are very different from those present in the single sources used, this above all because each single study is the result of a specific approach and examines the data from only one angle: Istat surveys are sample; those of Autostrade are based on data from the toll booths; to a large extent non-Italian vehicles circulate on the motorways, so we do not have all the data for them.
From the analysis of the historical series concerning goods, a decrease emerges on the urban / extra-urban component since 1990 while it increases on the motorway network. Anas data does not correspond with this version. On the motorways 20 to 50% of the vehicles/km of the total heavy transport circulate. For urban areas, data on freight transport are extrapolated from the SUMPs.
The overall figure records about 500 billion vehicles/km /year: 400 billion are represented by passenger transport (of which 386 billion are cars); 90 billion are made up of goods, which therefore represent 18% of the total, a share that in terms of emissions translates into 37% of the total, produced by heavy vehicles especially on the motorway, by light vehicles in urban and extra-urban areas.
Compared to the PATHs to 2030 survey, Ispra overestimates cars and underestimates heavy vehicles.
As regards the estimate of energy consumption and emissions, in 2019 greenhouse gas emissions and energy consumption reached a total 108 million tons of CO2 equivalent (for Ispra they are 97 million, because it underestimates freight vehicles), 37% of which produced by freight transport. Freight vehicles are much more polluting. From the emissions it is possible to calculate the amount of energy needed to produce them, which consists of 9 billion liters of fuel.
The possible ASI scenarios
Moving on to the second part of the study, the one concerning the definition of trend scenarios, Cascetta specified that this is the least consolidated part of the research, the one on which verifications and evaluations are still in progress, based on elements that we have available in the present, therefore the policies and the current regulatory framework.
Of course, in this case there are strong factors of uncertainty that affect the evolution of transport: the geopolitical crisis, the reshoring of the routes, the evolution of the offer, with a vehicle market that will have to deal with the availability of components for the different power supplies and legislative systems.
Basically, however, these are forecasts based on ASI policies and on on two possible scenarios, one optimistic and one more prudent. Foresee fewer vehicles / km (e.g. do not allow empty vehicles to travel), prefer more sustainable modes of transport than the road through the modal shift (rail, sea), use vehicles that produce less emissions, therefore younger and with alternative power supplies.
As for passenger traffic, the most optimistic forecast sees the return to 2019 flows; on the other hand, according to the most prudent forecast, traffic will remain at lower levels than before the pandemic.
As for the aspect of the Improve, the trend will depend on how much people are willing to change cars and what types of cars they choose. According to ACI data, in the early 2000s the replacement rate was around 8% per year, but with the years of the pandemic the figure is substantially halved, around 4%. In this case, the optimistic forecast sees a return to the replacement levels of the early 2000s, and in any case around 5.9%, therefore with a substantial scrapping of old cars; the pessimistic forecast, on the other hand, is that we remain with the data that have characterized the Covid years.
A separate discussion must then be made on how the car fleet is renewed. In 2019, electric cars accounted for 5% of sales; an optimistic forecast stands at 30%, while the more prudent one stops at 10% of the total number of new cars.
Hybrid cars represent a marginal share of the market until 2019; the figure grows from here onwards thanks to incentives and the most optimistic forecast stands at 50% of new cars in 2030.
In the optimistic scenario, therefore, only 20% of the cars sold in 2030 would be with combustion engines.
Freight is more polluting
As for goods, the issue is more complex because already today the traffic is higher than 2019. The optimistic forecast materializes in the possibility that by 2030 journeys over 300 km will take place by rail, thus providing for the maintenance of incentives such as Ferrobonus and Marebonus.
In this case, the slower rate of renewal that characterizes heavy vehicles counts: in the optimistic hypothesis, it will be possible to return to pre-Covid levels (5.2%). In commercial vehicles as a whole, there is the possibility that 1/3 is made up of Bev vehicles and the rest of Euro 6, making the Euro 0 disappear.
Finally, the working group outlined two borderline scenarios. In the first, all the new vehicles are electric, both for the transport of people and goods. The occurrence of this condition would result in a 23% reduction in emissions compared to 1990, therefore very far from the Fit for 55 target.
The second limit scenario imagines that by 2030 the entire fleet in circulation is electric, so that even old vehicles will magically become electric. In this case the CO2 reduction would be equal to 73% (the emissions produced by the heavy Euro 6 would still remain). To power these vehicles it would be necessary to increase the production of electricity by 23%, therefore, in this regard, it would be necessary to open the chapter relating to the decarbonization process of electricity production.
As mentioned above, this is the part of the study that is still being worked on and probably the next steps involve the development of other possible scenarios, one of which will probably involve the use of biofuels in the heavy lane segment.
Future scenarios imagined based on what the present allows. Possible back-casting scenarios – that is, starting from the future result to be obtained by proceeding backwards – can be traced in the continuation of the research.
Even assuming the renewal of the hyper-forced park, however – reaffirmed the president Cascetta – if the problem of goods is not addressed, the goal is unattainable. In the absence of active intervention policies, the result cannot be different.
![]()
Associazione Cluster Trasporti Italia 2020
Viale Pasteur, 10 00144 Roma
TEL +39 06 54221493 (4)
FAX +39 06 54221418
CF 97794560587
EMAIL cluster.trasporti@anfia.it